Here is a real-world example that may help make sense of all of this. Lets say your business uses a legacy ERP system that works great, but leaves a lot to be desired in terms of reliable analytics. {interface | STL} could help develop a computer program to automate exporting data from your legacy system at scheduled intervals. The program would cleanse, enrich, and upload the data to a Data Warehouse in the cloud. {interface | STL} could then build a modern interactive business intelligence dashboard (PowerBi) to view and analyze your business on-the-go anywhere in the world.
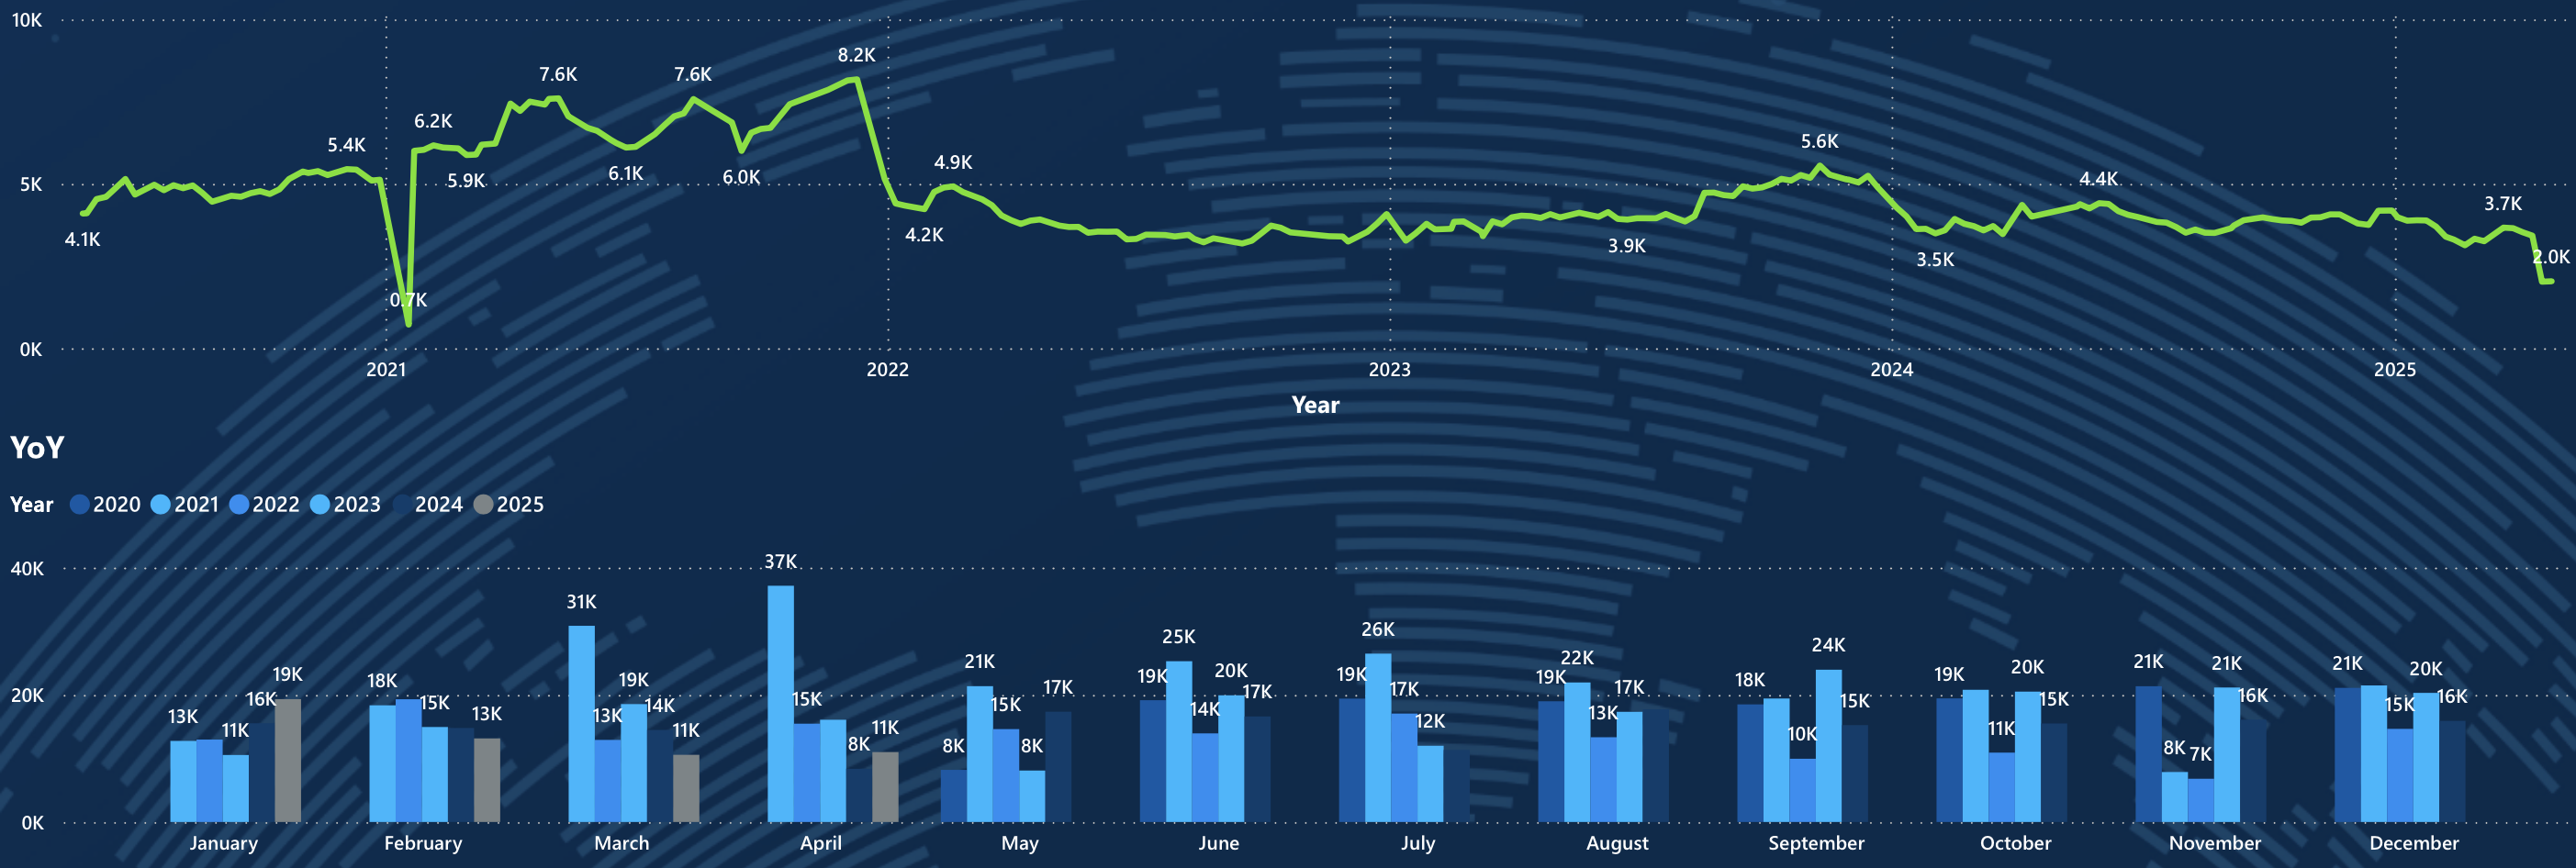
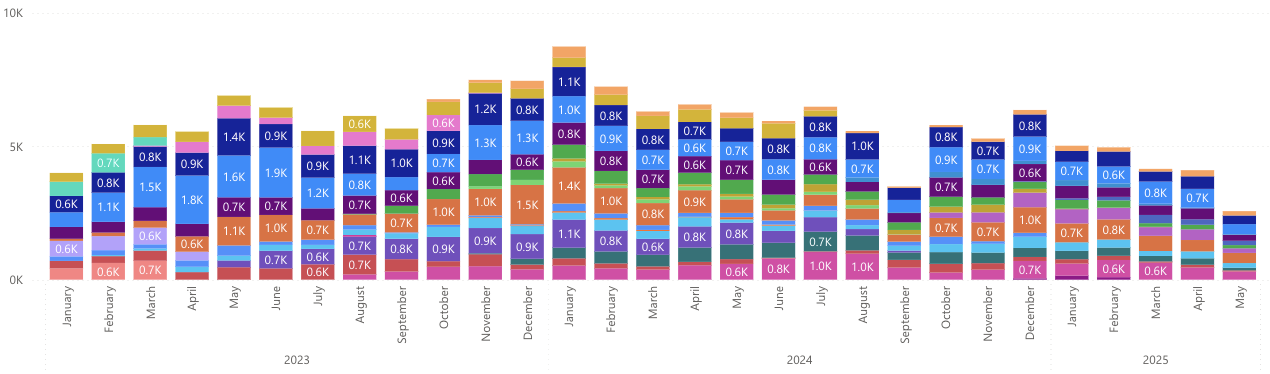
Visualize your data with interactive dashboards to monitor critical real-time metrics, analyze trends, detect anomalies in your business, and more!

Build websites for internal or external operations with custom functionality to: automate processes, provide global access to users, improve data collection/accuracy, & more!
Custom automated programs that efficiently collect, transform, enrich, and upload your data to a modern cloud-based database.